www.solutionsforall.com is a dynamic self-


Wolf Cries – Howling About Drought – All Wet – No More Doubts Officials Exaggerated Severity of Drought
By: Patrick Porgans and Lloyd Carter
MOTIVE FOR THE DROUGHT: Doubts are being raised as to why Gov. Arnold
Schwarzenegger issue a drought proclamation at the onset of the below average conditions,
and opted not to declared the drought as being over in 2010, when precipitation exceeded
110 percent of normal and statewide reservoir storage reach 95 percent of average.
Obviously, the drought proclamation opened up the floodgate to release hundreds
of millions of dollars of public moneys used to fund so-
Government documents support critics’ contentions that the Governor of California
and his supporters exaggerated the extent of the drought as a platform to promote
the passage of the $11 billion General Obligation Bond “Water Package” purportedly
designed to increase the state’s water supply reliability, improve its aging infrastructure,
and “fix” the broken Bay-
Meanwhile federal and state officials still appear to be at odds as to whether the
California "drought" is over. A review of the government’s own data, Figure 1, indicate
that the recent California “drought” was very mild at best in comparison to historical
droughts, contrary to the wolf cries of Fox, CBS, Governor and water bureaucrats.
This finding is prefaced on comparing data from the four-
Ironically, in the midst of a budget crisis, and the longest delay in adopting a
state budget, the public is paying for the drought relief programs, with billions
of dollars of borrowed money repaid from the $20 billion deficit-
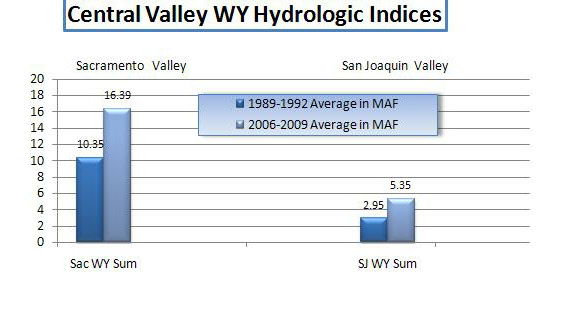
Figure 1 is in Million Acre-
Data in Figure 1, extrapolated from Department of Water Resources (DWR) Bulletin
120 series – Water Conditions in California, illustrates the difference in water
conditions prevalent during the 1989 through 1992 and the 2006 through 2009 drought
years (using four-
Figure 1 also indicates that there was a significant increase in the state’s water
supply within this past “drought” period as compared to the 1989-
Hydrologic and Water Supply Conditions and Precipitation in California:
The 2009 Water Year (October 1, 2008 through September 30, 2009) was the third consecutive
year of below average precipitation for the state. In DWR Bulletin 120 series, Summary
of Water Conditions, statewide precipitation totaled 80 percent, 85 percent, and
65 percent of average for Water Years 2009, 2008, and 2007, respectively. According
to DWR’s Bulletin 120, water year 2006 was 140 percent above average. Ironically,
the average for that four years was 92percent of normal precipitation; reservoir
storage for that same period would have averaged out to 96 percent. Furthermore,
at the end of 2009 statewide reservoir storage was averaging 80 percent of capacity.
In addition, according to DWR’s Bulletin 120-
Conversely, during the previous drought, reservoir storage capacity statewide in
1992, the last year of that drought, was at 70 percent; average for the 1989-
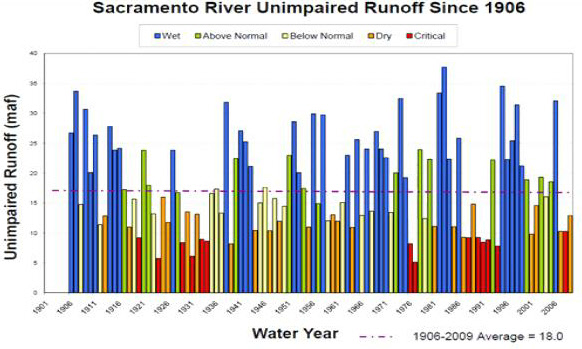
Wet and dry cycles are a part of California’s climate, as is indicated by water runoff,
which is illustrated in Figure 2. Precipitation varies widely from year to year.
In average years, close to 200 million acre-
S Over half of that water soaks into the ground, evaporates or is used by native
vegetation. That leaves somewhere around 82 million-
S About 75 percent of California’s available water occurs north of Sacramento, while
about 80 percent of the demand occurs in the southern two-
S There have been about 30 years out of 92 (since 1918) or about one in every three years that the state includes as part of a drought period.
The North Coast Hydrological Region produces the largest volume of runoff; however,
it has limited storage capacity. The Sacramento River Basin is the second-
Figure 2: Sacramento River Unimpaired Runoff Since 1906 – Source, DWR
As indicated on the Sacramento River Unimpaired Runoff Since 1906, California has
experienced eight-
General Fund Being Drained by Budget Crisis and Government-Induced Drainage Crisis
While Californians were held captive waiting for Governor Arnold Schwarzenegger and
the Legislature to adopt a budget, more than 100 days late, costing “We the People”
$52 million a day; more than $4 billion to date, with interest $8.2 billion, according
to the State Treasurer’s office; officials are also throwing $100s of millions down
the drain and compounding California’s government-
Within the past decade California has been besieged by a water supply crisis, a budget
crisis, a credit-
The primary sources of the water quality crisis is from toxic salt discharge from
lands irrigated by subsidized water delivered by the federal Central Valley Project
to contractors “farming” on the arid west side of the San Joaquin Valley. Millions
of acre-
Toxic salt loading is not only taking its toll on the river and Bay-
Water officials have wasted more than $10 billion and 35 years in extended delays
in their failed attempt to carry out their legal mandates to protect the waters of
the state and restore the Bay-
The fact remains that for decades the “responsible” government officials and political
appointees on both the State Water Resources Control Board and the Central Valley
Regional Water Quality Control
Board (boards) have been sanctioning the discharge
of trainloads of toxic substances into the San Joaquin River and the Sacramento-
A significant portion of the San Joaquin River has been declared to be water quality
impaired-
distinction
is the direct result of the boards’ failure to take action to stop the discharge
of these toxic substances into the waters of the state, which exceed both state and
federal water quality standards.
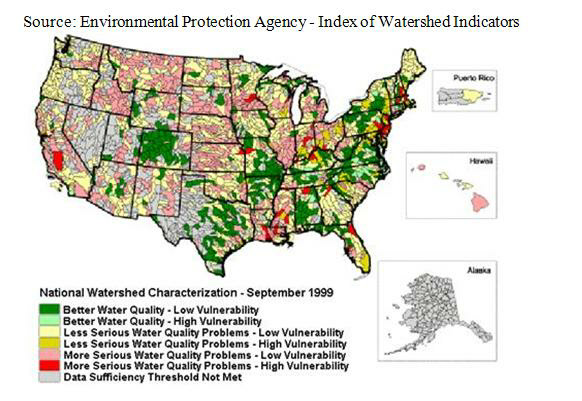
Source: Environmental Protection Agency -
For Further information regarding this Map go to:
http://www.unl.edu/nac/atlas/Map_Html/Clean_Water/National/EPA_IWI-
How much salt are we talking about? According to a U.S. Geological Survey report
(at page 106), about 17 railroad cars a day, each capable of carrying 100 tons of
salt (sodium and chlorides, as well as the really nasty trace elements like selenium
and mercury), about 3.4 million pounds per day being dumped in the lower San Joaquin
River in Merced County and sent on down to the Delta. In theory, some of the “experts”
claim is ultimately flushed to sea, and the rest perhaps enters the aquatic food
chain or at least degrades cleaner Delta water. As far back as the 1990s, evidence
was provided by board’s staff that the salt loads into the valley are “doubling”
every five years! (Source: State Water Board’s Bay-
Proponents of the San Joaquin Basin Plan Amendment, which will be the subject of discussion at the State Board’s 5 October meeting, argue that the 1995 Grasslands Bypass Project has reduced toxic salt loading to the surface waters of the state. However, the tons of toxics salts that are being discharge daily into the waters of the state are only the tip of the “iceberg. An unfathomable amount of toxic salts are being stored in the soil profile and is contaminating groundwater basins throughout the valley.
Since its inception, critics of the Grasslands Bypass Project argued that the project
would not work, simply because the only real way to resolve the discharge of the
tons of toxic salts is to stop irrigating those lands that have known drainage problems.
Despite the common sense urged by the critics, and a 1995 agreement between the
officials and the agricultural drainers to bring the trainloads of salt to a halt
by no later than 1 October 2010, the State Board will consider continuing the present
noncompliance until 2019.
http://www.swrcb.ca.gov/water_issues/programs/tmdl/docs/sjr_selenium/resolution092210.pdf
At the urging of the project’s water contractors, the government knowingly supplied
subsidized water to irrigate valley lands without requiring the federally-
In 1968, the State Board adopted its Anti-
“California’s anti-
The State Water Board and the Regional Water Boards are responsible for swift and fair enforcement when the laws and regulations protecting California's waterways are violated. The State Water Board's Office of Enforcement assists and coordinates enforcement activities statewide.
A coalition of concerned parties, including the author, will state their protest of the proposed extension of time, at the board’s meeting. Refer to Open Letter to the State Water Resources Control Board at www.lloydgcarter.com or you are invited to read more detailed information on related stories at www.planetarysolutionaries.org
HAY! DOUBT ABOUT THE DROUGHT?
Making hay and burning up water in the desert sun – Shipping Rice and Hay (and lots of water) to Japan – Does it make sense? Is it sustainable? All this while California water officials cry drought
In 2009, the last year of the so-
The two things that hay and rice have in common are that both of them consume a great deal of water for their dollar value and they produce very little net income.
According to the U.S. Department of Agriculture (USDA), the California rice harvest in 2009 was up nine percent from the previous year and near the record crop of 2004.
According to a University of California, Davis, report, the minimum amount of water required to grow a crop of rice is about 42 inches; however, unavoidable losses due to percolation and tailwater outflows can add to this amount so that the amount of water consumed (or evaporated) can but can be up to as much as 100 inches per acre, depending on the soil. That appears to be enough water to drown the tallest person on earth.
The California Rice Commission, a trade group representing 2,500 rice farmers,
estimates that rice uses 2.2 million acre-
In 2008, University of California Davis data show California exported 52 percent of its rice production, much of it to Japan. Furthermore, for every pound of rice exported, about 250 gallons of “virtual” or “embedded” water used in growing and processing that rice leaves along with it, according to “Water Footprints of Nations,” a 2004 study from the Netherlands for UNESCO (The report spawned the Web site www.waterfootprint.com .)
The rice harvest should be of great consolation to the chairman of the California
State Water Resources Control Board, Charles Hoppin, who is also a rice grower, vice-
Chairman Hoppin, in a March speech in Yuma, Arizona, complained the regulatory community, including much of his staff, doesn't know or understand the issues facing agriculture and "doesn't give a rat's ..."
According to the Environmental Working Group, rice subsidies in California totaled
$2.4 billion from 1995-
Unfortunately, USDA has not provided recipient detail for rice cooperatives. Farm
recipients of USDA subsidies in California totaled $9,123,000,000 in from 1995-
According to EWG, “Washington paid out a quarter of a trillion dollars in federal farm subsidies between 1995 and 2009, but to characterize the programs as either a "big government" bailout or another form of welfare would be manifestly unfair – to bailouts and welfare.” http://farm.ewg.org/summary.php
Hey! And where is that Imperial Valley water-
In the Imperial Valley of California, a region drier than part of the Sahara Desert,
farmers have found a lucrative market abroad for a crop they grow with Colorado River
water: They export bales of hay to land-
It should be remembered that California agriculture now consumes 75-
According to a report by the Peter H. Gleick, with the Pacific Institute, “This
is water that is literally being shipped away,” said Patrick Woodall, research director
at Food and Water Watch, an international consumer advocacy group with headquarters
in Washington, D.C. “There’s a kind of insanity about this. Exporting water in the
form of crops is giving water away from thirsty communities and infringing on their
ability to deal with water scarcity. This is a place where some savings could be
made now, and it’s just not being discussed.” http://www.miller-
Are the taxpayers, who have poured billions of dollars into California’s water
infrastructure, getting a good return on their money? Is this type of use of the
public’s water resources sustainable? In the past several decades tens-
Taxpayers may want to remember this when California’s “water lords” try to float another $11 billion water bond ($22 billion by the time it is paid off) in the 2012 election.
Government Data Raises 'More Doubts About the Drought
Government Data Raises ‘More Doubts About the Drought’ -
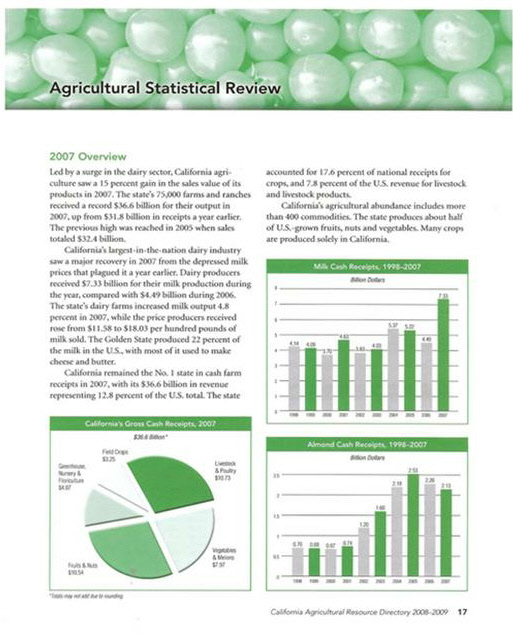
The Golden State’s agricultural earnings have reached
historic highs during the so-
California’s Governor Schwarzenegger, state water officials, 60 Minutes’ Leslie
Stahl, and Fox Cable TV host Sean Hannity, were among those espousing their “Dust
Bowl” drought rhetoric for the past three years, depicting images or fallow fields,
orchards being ripped out and projections of the state’s agricultural industry going
under. It appears their doomsday predictions were all wet.
Government data released
yesterday by the USDA, does not support their draconian doom and gloom prophecies
reminiscent of the “Great Drought – Dust Bowl” of the 1930’s, and their predictions
that billions of dollars in lost revenues were imminent.
In fact, in 2008, the second
year of what officials proclaimed as the state’s “worst drought ever”, agricultural
“cash receipts” (revenues realized from all agricultural commodities produced in
the Golden State) reached a record-
But wait, in 2009 the third year of the government
“proclaimed drought”, agricultural cash receipts reach $34.8 billion. There’s more,
the state’s 75,000 farms and ranches received a record $36.4 billion for their output
in 2007, up from $31.8 billion in receipts a year earlier (2006), which was a very
wet year. The previous high for the state’s annual cash receipts was reached in 2005
when sales totaled $32.4 billion.
Furthermore, the reduction in cash receipts from
2008 to 2009 is predominately attributed to the significant reduction in California’s
decline in revenue was led by the dairy sector, not the results of the “drought”
or curtailment in Sacramento-
According to the USDA’s report dairy -
The
record-
According
to the government, Agricultural Statistical Review, “Almond Cash Receipts, 1998-
Coincidentally, the government’s records show that during California’s previous drought,
which occurred from the years 1987 through 1992, and, if the government’s records
are valid, was, without question, a much worse drought then this latest so-
The records also attest to the fact that between
1998 and 2001, cash receipts from almond production remain relatively constant at
around $700 million annually. The increase in almond production (new orchards) was
done with the full knowledge that the risk of a drought could have potential adverse
impacts on permanent crops, which absolutely require water every year.
However,
that apparently did not serve as a deterrent. Be mindful that many of the major government
surface water projects were built as back-
In their rhetoric, the officials and the media, showed pictures
of almond orchards being ripped out in certain areas of the arid San Joaquin Valley;
however, they failed to inform the public that in some cases those orchards were
being ripped out and replaced with a higher and more productive variety of almonds,
and/or because some of the orchards had outlived their useful production years.
The
global financial crisis also played a key role in the demands for certain high-
Next in the series: Harvesting Windfall Profits from the so-
~~~~~~~~~~~~~~~~~~~~~~~~~~~~~~~~~~~~~~~~~~~~~~~~~~~~~~~~~~~~~~
Patrick Porgans and author Lloyd G. Carter are involved in publishing a series of articles, entitled: “Doubts About the Drought." For more information you can Google Hay! Doubts About the Drought, or visit the following websites; http://www.planetarysolutionaries.org and http://www.lloydgcarter.com